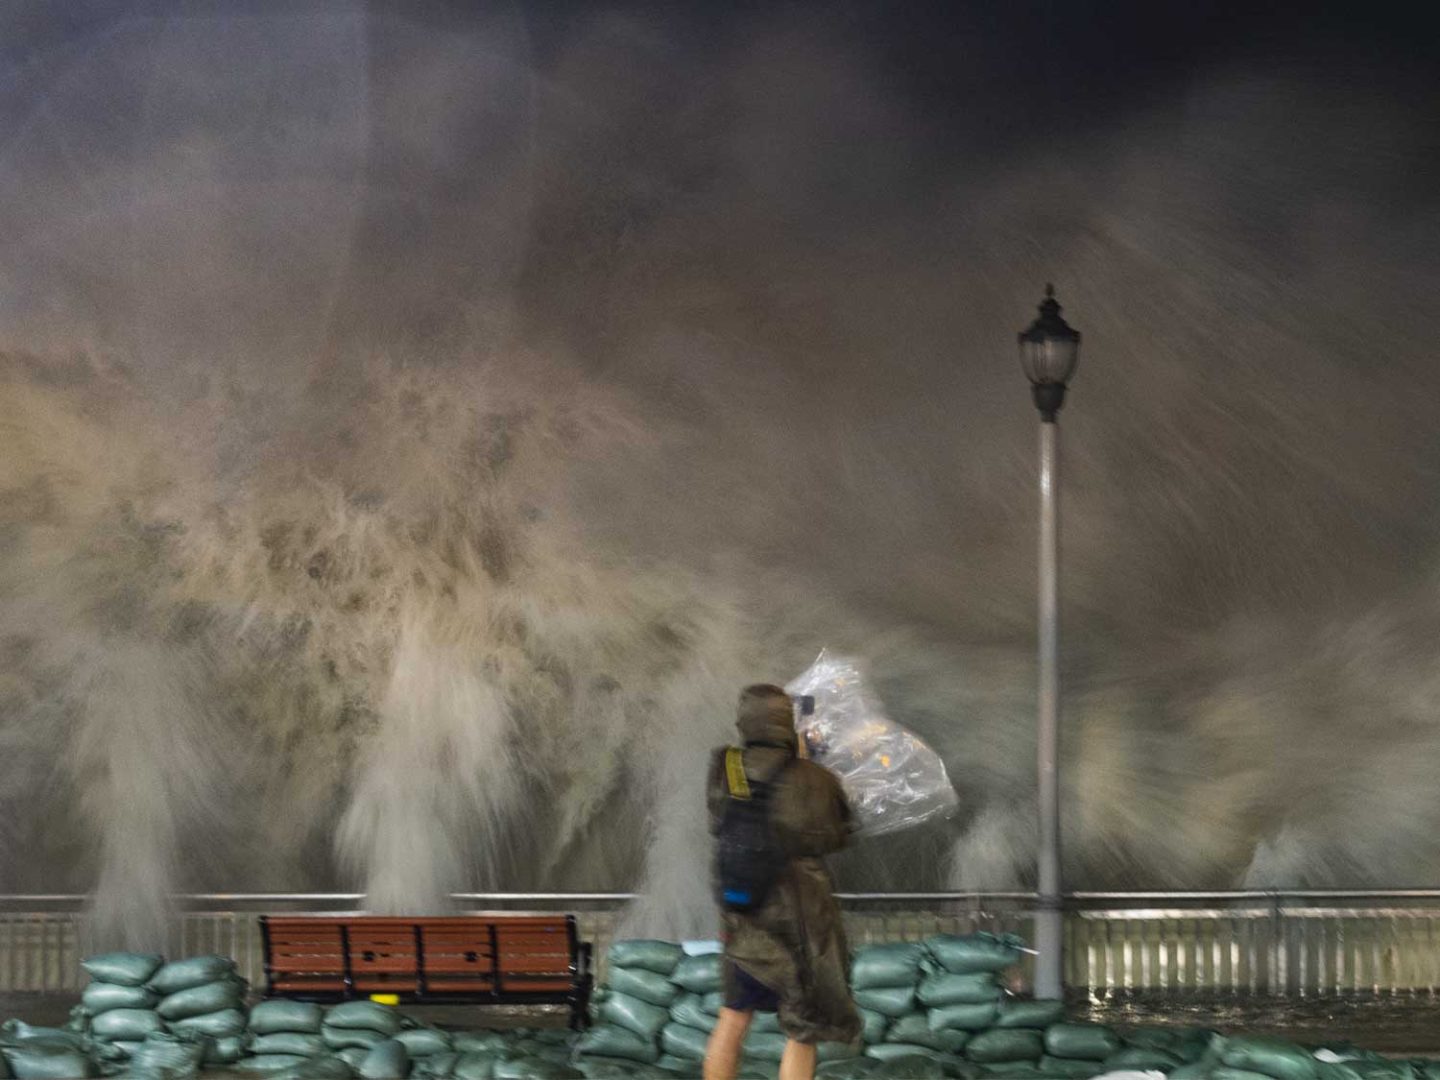
The recent sinking of the Prestige Falcon oil tanker, following a Houthi attack, marks the deadliest incident involving these strikes to date.
The vessel capsized near the Omani coastal city of Duqm, and while the Indian Navy rescued nine of the 16 crew members, one was found deceased, and six remain unaccounted for, feared to have gone down with the ship.
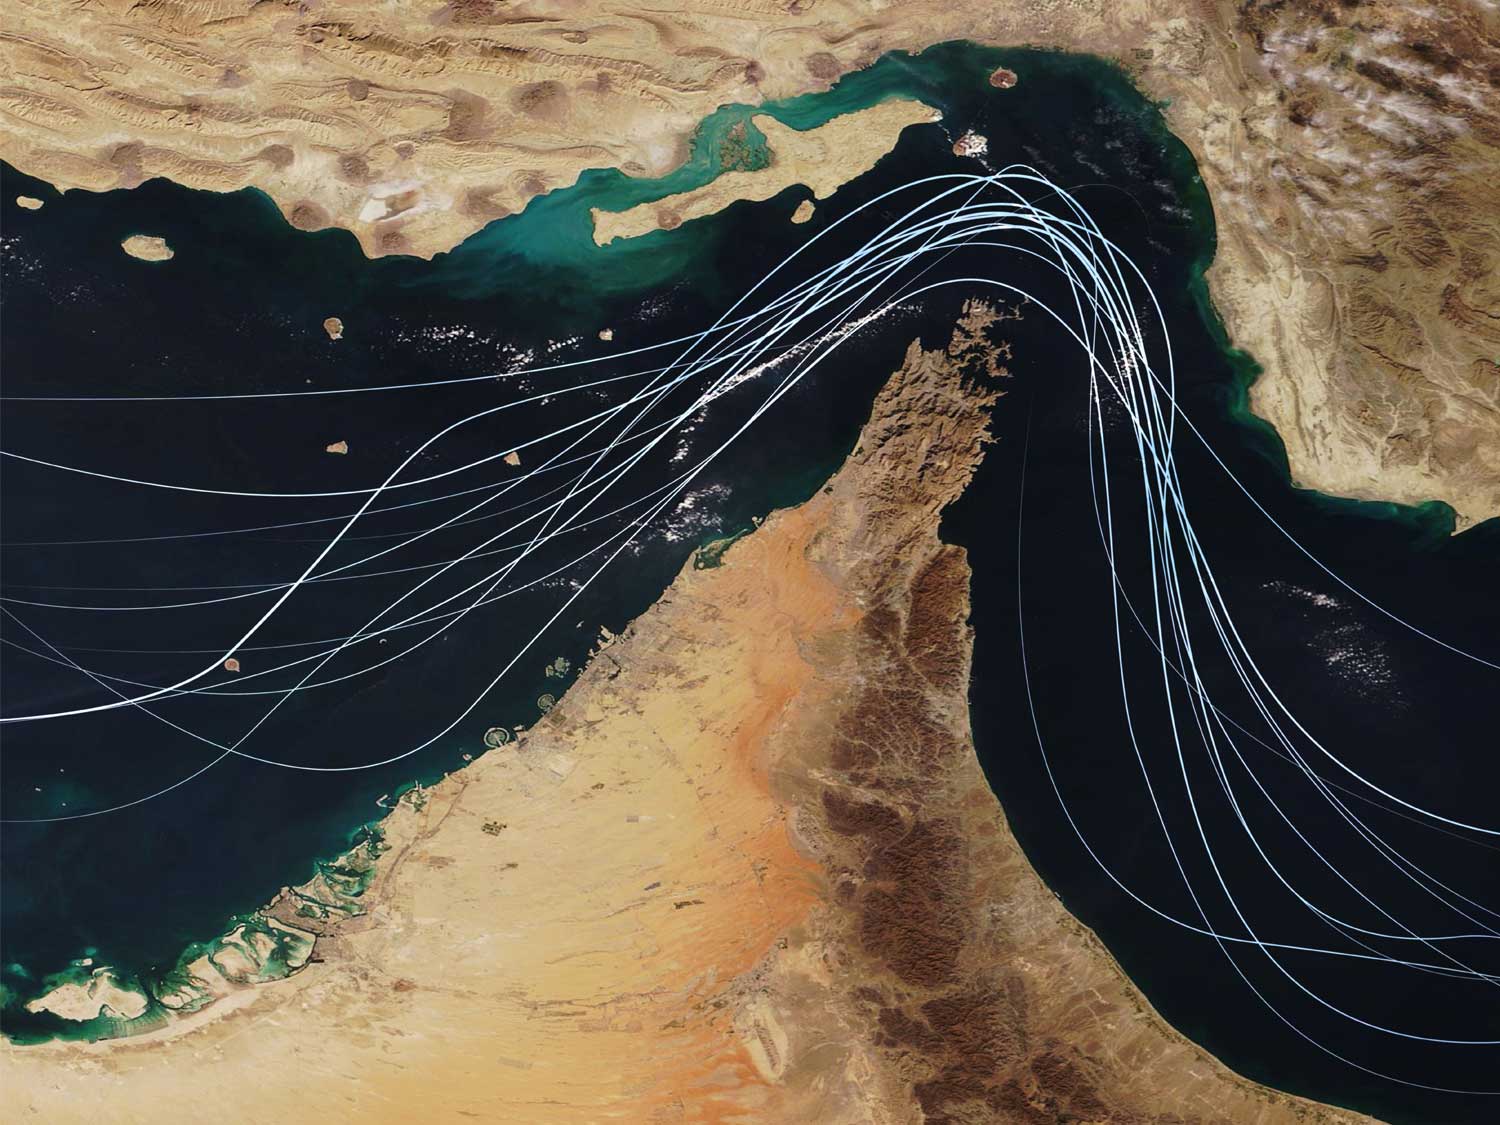
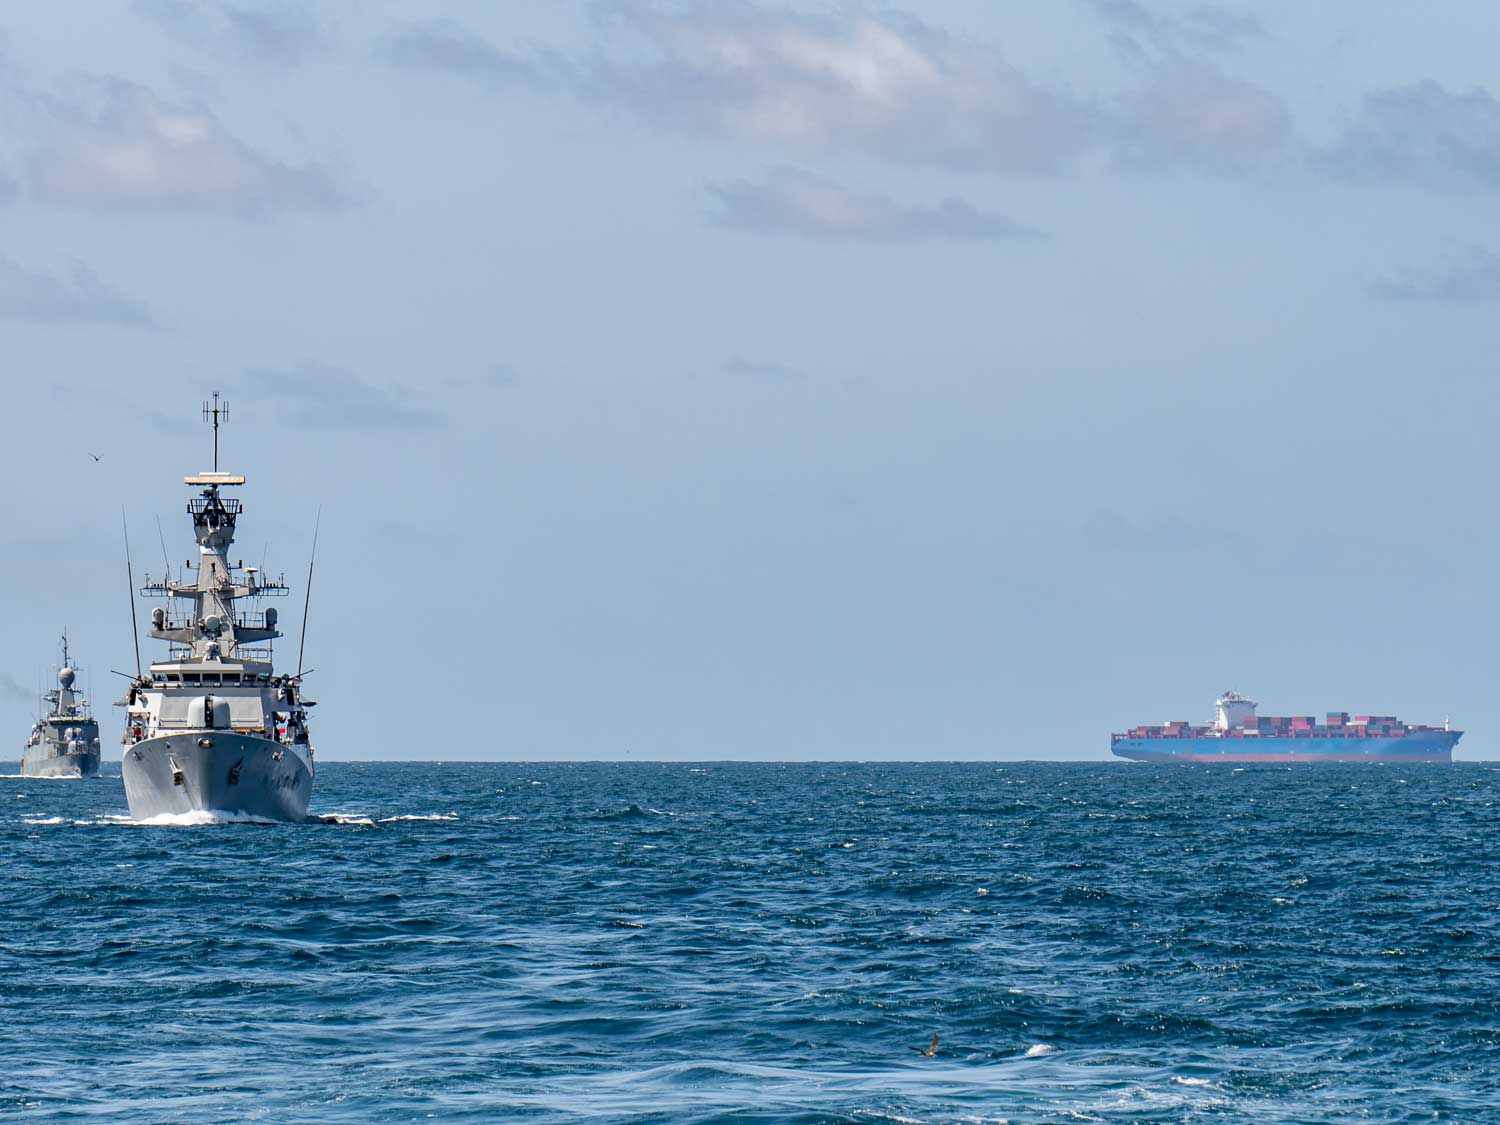
The Prestige Falcon, flagged under the Comoros, was targeted approximately 5 nautical miles southeast of Ras Madrakah, Oman, closer to the Persian Gulf than the typical Red Sea and Bab al-Mandeb strait attack zones. With at least 100 Houthi attacks on merchant ships so far, resulting in the deaths of four seafarers, this incident could significantly increase that toll.
These Red Sea attacks have contributed to elevated containership charter and freight rates. Industry experts predict continued Cape of Good Hope diversions until at least 2025, keeping rates high.
Recent escalations include Israel’s attack on the Hodeidah port in Yemen, following a Houthi drone strike on Tel Aviv. The method of the Houthi drone attack remains unclear, raising concerns about potential threats to shipping in the Eastern Mediterranean.
Speculation suggests the drone may have been launched with the aid of militants closer to Israel, highlighting the risk of supply chain disruptions if drones can be deployed from nearer locations or if groups like Hezbollah become involved.
The Houthi’s have already warned that they plan to expand their campaign of attacks on commercial shipping, to include vessels in the Mediterranean. While the Pentagon has stated that the US has seen no sign of the Iran-armed rebels attempting to do so yet, it has admitted to being worried about the possibility.
“The Houthis have an advanced array of weaponry and they have weapons that could reach the Mediterranean. It definitely is of concern that they have that capability.”
According to some projections, the current Houthi attack campaign will continue for at least the rest of this year, and many commercial vessels will keep avoiding the Gulf of Aden and southern Red Sea until 2025 or beyond. In fact, it could get much worse with some of the new developments this week between Israel and The Lebanon also. We will endeavour to keep you updated as frequently as news is issued and on the impact associated with your supply chain and logistics requirements.
Experts warn that until the Houthis are deprived of the weapons they are using to conduct these attacks at source, we should expect more attacks and damage to international trade.
If you have concerns or questions about the issues covered here, please EMAIL our Chief Commercial Officer, Andy Smith.